Introducing Tidyverse-Part 1:Tidy Data
By Ou Zhang in R Data science
May 9, 2020
Hi, I'm the here-bot cat!
Use me to find your way in your website.
- Here I am:
- content/blog/2020-05-09-tidy-data/index.html
- Here is my R Markdown source file:
- blog/2020-05-09-tidy-data/index.Rmd
You'll want to edit this file, then re-knit to see the changes take effect in your site preview.
To remove me, delete this line inside that file: {{< here >}}
- My content section is:
- blog
- My layout is:
- single-sidebar
- Images in this page bundle:
- /blog/tidy-data/featured.jpg
- /blog/tidy-data/img/data1.png
- /blog/tidy-data/img/data2.png
- /blog/tidy-data/img/data3.png
- /blog/tidy-data/img/measure_data1.JPG
- /blog/tidy-data/img/measure_data2.JPG
- /blog/tidy-data/img/r4ds_data-science.png
- /blog/tidy-data/img/tidy_data.png
- /blog/tidy-data/img/tidyverse.png
- /blog/tidy-data/img/tools_for_tidy.jpg
In an ideal world, a data analysis process is as simple as-read in data, select a suitable model to fit in data, obtain statistical estimates, and finally, interpret the analysis results. Sounds simple and straight forward, isn’t it?
But, in reality, it’s often not that simple!Data is always messy and often times we need to clean our data before we can make any sense of it. Moreover, some researchers found that more than 80% of data analysis is actually spent on data preparation or data manipulation (Dasu & Johnson, 2003), so that the data is transformed into a usable format before you even think about analysis.
Therefore, data cleaning or data wrangling is utmost important for any data analysis or data science project.
In the early 2010s, Hadley Wickham invented one of the most important R package series - Tidyverse.

Figure 1: Tidyverse
The tidyverse is an opinionated collection of R packages designed for data science. All packages share an underlying design philosophy, grammar, and data structures. It mainly focuses on the data wrangling steps including data import/export, data format conversion, data wrangling or data tidying. The ideal data analysis process, or the standard process explained by Hadley. The workflow looks like the chart below.
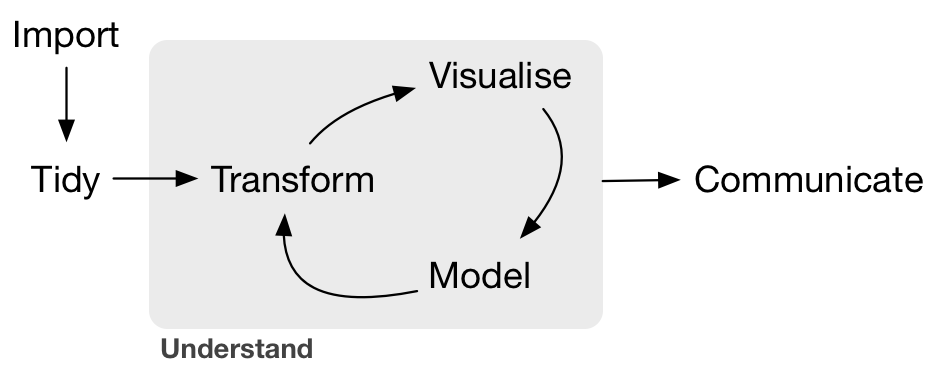
Figure 2: data analysis flow
The idea of data tidying is the first step and standard way to structure datasets for later data analysis.
On the internet, you can easily google tons of information and websites introducing this R-package collection. However, most of the introductions, only spend one or two paragraphs to depict the definition of Tidy data. Then they move on to the command line examples and description of relevant package applications. Only Hadley’s own R for Data Science book, spent an entire chapter to give a detailed story about Tidy data. Because of its importance, Hadley published a paper, solely introducing the definition of Tidy data.
You can find the paper from this link: Tidy data.
The paper itself claims the Tidy data definition matches Codd 3rd normal form.
As a data scientist, personally I think the Tidy data is more than just great. It is not just an idea, but provides a comprehensive “philosophy of data” in terms of data wrangling, and data science. For that reason, I would like to write a bit on the definition and history of the phrase tidy data as my first blog series of Tidyverse introduction.
What is Tidy data?
The first question is-What is tidy data?
Tidy data is a specific way of organizing data into a consistent format which plugs into the tidyverse set of packages for R. It is not the only way to store data and there are reasons why you might not store data in this format, but eventually you will probably need to convert your data to a tidy format in order to efficiently analyze it.
There are three rules which make a dataset tidy:
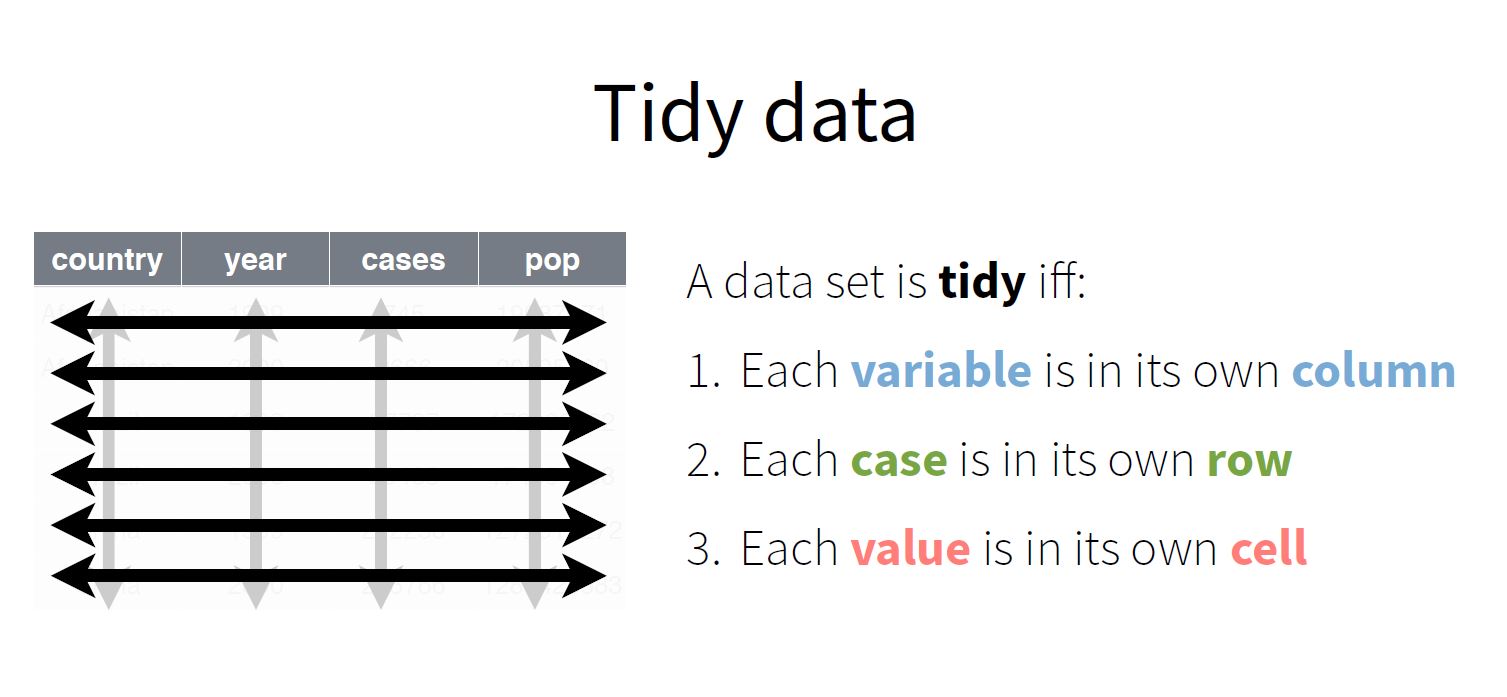
Figure 3: data analysis flow
Tidy data is particularly well suited for vectorized programming languages like R (R Core Team 2014), because the layout ensures that values of different variables from the same observation are always paired.
Please note that this concept was already well known in statistics and called a data matrix. For example:
A standard method of displaying a multivariate set of data is in the form of a data matrix in which rows correspond to sample individuals and columns to variables, so that the entry in the ith row and jth column gives the value of the jth variate as measured or observed on the ith individual.
Krzanowski, W. J., F. H. C. Marriott, Multivariate Analysis Part 1, Edward Arnold, 1994, page 1.
Why is it important?
The 2nd question is-why is this Tidy data structure important?
The short answer is in three folds.
- Organizing datasets as tidy data makes data cleaning efforts easier
- Broad range of analytical tools are built upon the assumption to consume tidy data
- Sharing tidy data increases re-use
The figure below displays the tools for tidy data in the Tidyverse package series.
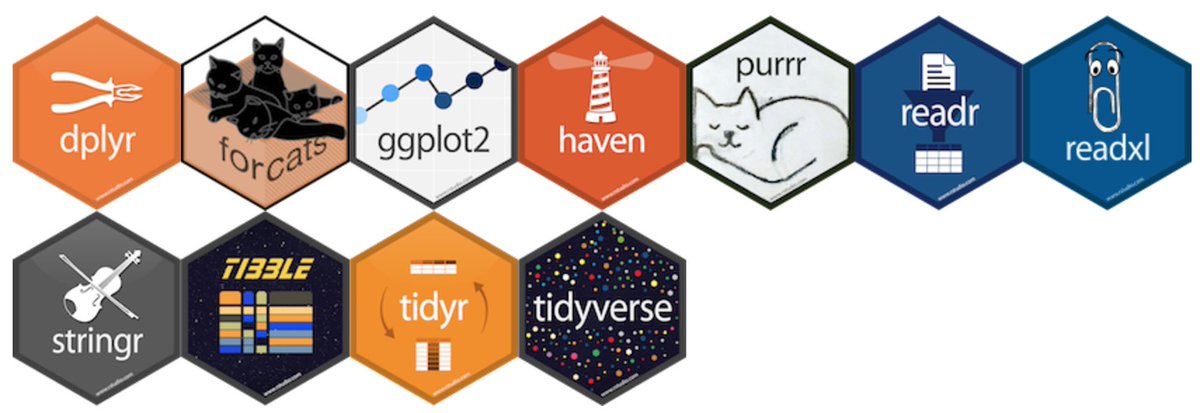
Figure 4: Tools for Tidy data
Fixed variable vs. Measured variable
In general, two types of variables exist in the tidy data structure, fixed variable and measured variable.
Fixed variable- Fixed variables describe the experimental design and are known in advance.Measured variable- Measured variables are what we actually measured in the study.
In the Tidy data structure, fixed variables should come first, followed by measured variables, each ordered so that related variables are contiguous. Rows can then be ordered by the first variable, breaking ties with the second and subsequent (fixed) variables.
Is such a data set tidy?
While starting data analysis, data scientists should ask themselves this question before moving on to the real data analysis.
This question is:
Is this data set tidy?
Let’s look at a couple of data structures and ask yourself this question.
Example 1:
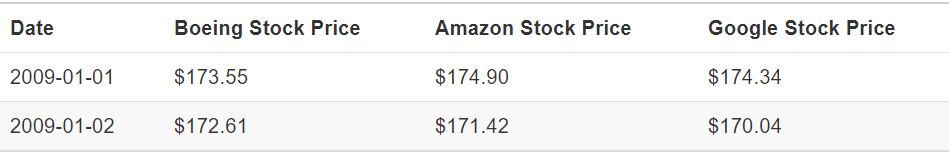
Figure 5: data 1
So, is this data structure a tidy data?
The short answer is No, it's not tidy data. This is because variable 2 to 4 (column 2-4) are all stock price. And according to tidy data rule No. 1- Each variable must have its own column. All three variables should be transformed into a single variable to store stock price values and create a new variable to indicate stock names.
Example 2:
Let’s look at the 2nd data example.
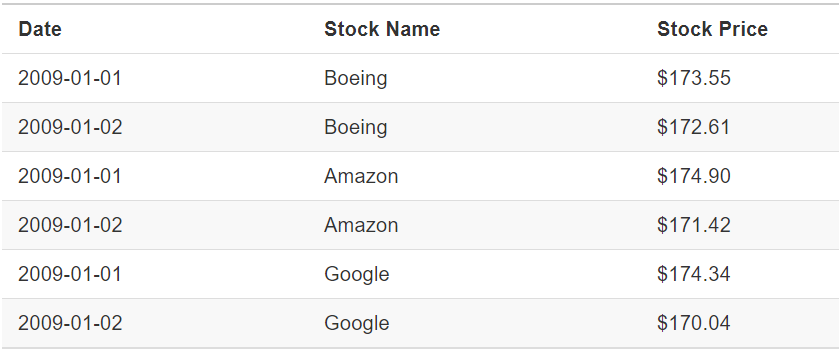
Figure 6: data 2
So, is this data structure a tidy data?
The answer is Yes, it is tidy data. And you can tell that the data structure 2 meet all three conditions of tidy data. Moreover, it is the data structure 1 after tidy data transformation.
Example 3:
Let’s look at the 3rd data example to reinforce the tidy data idea.
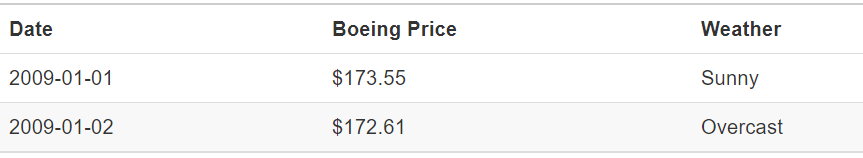
Figure 7: data 3
So, is this data structure a tidy data?
Yes, it is tidy data. And you can tell that the data structure 3 is similar to the data structure 2 with only 3rd variable differences. It meets all three conditions of tidy data as well.
Code Examples
So, you’ve seen some data examples and let’s run some dynamic codes as tidy data examples. The code below display the same data with 4 different structures. One dataset (tidy data structure) is much easier to work with in R than others.
## # A tibble: 6 x 4
##   country      year  cases population
##   <fct>       <int>  <int>      <int>
## 1 Afghanistan  1999    745   19987071
## 2 Afghanistan  2000   2666   20595360
## 3 Brazil       1999  37737  172006362
## 4 Brazil       2000  80488  174504898
## 5 China        1999 212258 1272915272
## 6 China        2000 213766 1280428583
Data 1 is tidy data structure, because each variable has its own column (i.e., country, year, cases, and population). And each observation has its own row. Finally, each value has its own cell.
## # A tibble: 12 x 4
##    country      year key             value
##    <fct>       <int> <fct>           <int>
##  1 Afghanistan  1999 cases             745
##  2 Afghanistan  1999 population   19987071
##  3 Afghanistan  2000 cases            2666
##  4 Afghanistan  2000 population   20595360
##  5 Brazil       1999 cases           37737
##  6 Brazil       1999 population  172006362
##  7 Brazil       2000 cases           80488
##  8 Brazil       2000 population  174504898
##  9 China        1999 cases          212258
## 10 China        1999 population 1272915272
## 11 China        2000 cases          213766
## 12 China        2000 population 1280428583
Data 2 intermingles the values of population and cases in the same column-value. So, data 2 is not tidy data.
## # A tibble: 6 x 3
##   country      year rate
##   <fct>       <int> <chr>
## 1 Afghanistan  1999 745/19987071
## 2 Afghanistan  2000 2666/20595360
## 3 Brazil       1999 37737/172006362
## 4 Brazil       2000 80488/174504898
## 5 China        1999 212258/1272915272
## 6 China        2000 213766/1280428583
The case and population variables in data 3 are in the same column.
## # A tibble: 3 x 3
##   country     `1999` `2000`
##   <fct>        <int>  <int>
## 1 Afghanistan    745   2666
## 2 Brazil       37737  80488
## 3 China       212258 213766
data 4 only includes the case variable and the population variable is missing.
## # A tibble: 3 x 3
##   country         `1999`     `2000`
##   <fct>            <int>      <int>
## 1 Afghanistan   19987071   20595360
## 2 Brazil       172006362  174504898
## 3 China       1272915272 1280428583
data 5 only includes the population variable, and the case variable is missing in the dataset.
Traditional measurement testing dataset
As a psychometrician, the data we usually encounter is the traditional measurement testing data. In order to fit the data into the traditional IRT or CTT software (i.e., WINSTEPS), the data structures are either item score matrix,
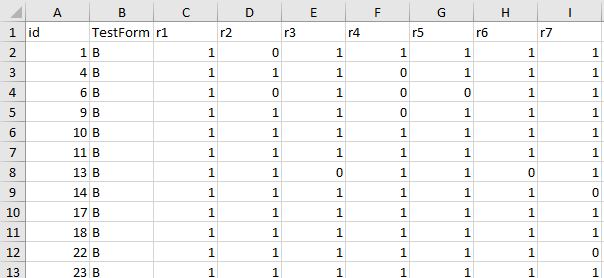
Figure 8: measurement data type 1-item score
or item response matrix,
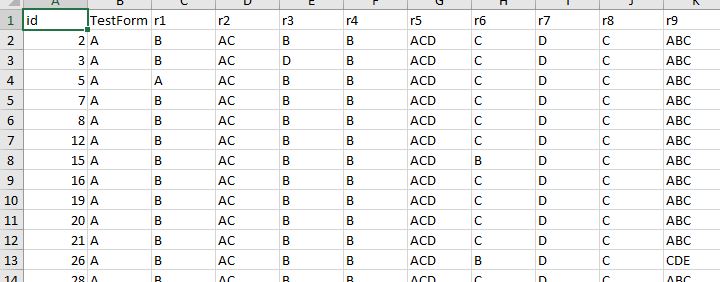
Figure 9: measurement data type 1-item responses
These 2 data structures are NOT tidy data.
Is this a big problem for psychometrics using tidy data structure?
The answer is NO.
For the psychometrics, we can apply tidy data structure in our works, because psychometrician or data scientist could always develop a standard data conversion module to transform the standard tidy data structure to the special data format customized for the traditional testing statistics software usage.